It’s Talladega week and Jordan is joined by Brandon Cruz to break down this weekend’s Playoff race, as well as discuss the Las Vegas event. Topics discussed:
01:45 – Las Vegas recap. Was that the worst race of the year?
11:30 – Shitbox special
18:30 – Who is Brandon Cruz?
25:35 – Is NASCAR DFS getting boring?
35:40 – Talladega race preview and fantasy strategy
You can listen below by using that embedded player or listen on:
We have our last race of the season where starting position doesn’t matter except for NASCAR Fantasy players this weekend, a.k.a. the final superspeedway race of the year: the YellaWood 500 at Talladega Superspeedway. Thanks to his victory at Las Vegas last weekend, his second win in this year’s Playoffs, Denny Hamlin is on the pole for the upcoming YellaWood 500 is also the favorite to win according to most sportsbooks.
[dropdown]
[dropdown-option]Select one…[/dropdown-option]
[dropdown-option value=”rosters″]Team Rosters / Results[/dropdown-option]
[dropdown-option value=”driverpoints”]Points Scored by Drivers[/dropdown-option]
[/dropdown]
[dropdown-content value=”rosters″]
Your Entry
[table-user-filtered id=2221 responsive=scroll /]
All Entries
You can click on the headers to sort by score, rank, etc.
The greatest city in the world is the site of this weekend’s tripleheader of NASCAR races, as Las Vegas Motor Speedway kicks off Round 2 of the Playoffs for the Cup Series on Sunday night. Yes, we’re getting a rare Sunday night race with no holiday the next day; getting up for work on Monday should be fun. This is the second race at Las Vegas this season, with Kyle Larson taking the checkered flag in the first event (big surprise, right?). Kurt Busch won the Playoff race here last season, although it was Denny Hamlin that led the most laps.
Kyle Larson and Ryan Blaney will lead the field to the green on Sunday night in Sin City, and for the full starting lineup you can click here. My FanDuel article for this weekend’s race can be viewed by clicking here, and since there’s so much crossover between these two DFS sites, I always recommend checking that out. Now let’s goooo!!!!
Enjoy the FREE content that this site offers each week? Consider donating to support by clicking here.
Also, be sure to check out the Algorithm Predicted Finishing Order for this race by clicking here!
Speed Report & Loop Data Driver Averages
Photo Credit: Jared C. Tilton | Getty Images
We’re focusing on “low wear” 1.5-mile tracks this weekend. For this season, that means we’re looking back at the first Las Vegas race, the Kansas race, and the Charlotte race. You can also look into data from the All Star Race at Texas if you’d like. Included in the data tables below is also the 2020 data from “low wear” 1.5-mile tracks. Also included is the data from this year under the 550hp package, as we’re back to running that this weekend. Statistics included in the tables below are:
Starts
Finish
ARP = average running position
DR = driver rating
FL = fastest laps (total)
LL = laps led (total)
T15 = laps ran inside top 15 (total)
Total Laps = laps completed (total)
2021 Driver Averages At “Low Wear” 1.5-Mile Tracks
Driver
Starts
Finish
ARP
DR
FL
LL
T15
Total Laps
Kyle Busch
3
02.3
06.7
112.2
67
21
863
934
Brad Keselowski
3
05.3
08.5
108.2
56
105
755
934
Chase Elliott
3
06.7
07.1
104.6
62
44
840
934
Kyle Larson
3
07.0
02.4
139.6
193
562
925
934
William Byron
3
07.0
06.1
109.5
99
44
862
934
Denny Hamlin
3
07.7
07.9
105.7
39
57
824
934
Austin Dillon
3
09.3
11.6
89.3
25
1
741
934
Chris Buescher
3
10.0
16.1
79.1
8
13
358
934
Kevin Harvick
3
10.7
10.2
92.8
27
0
708
933
Tyler Reddick
3
12.7
12.1
85.7
36
13
680
933
Matt DiBenedetto
3
12.7
15.4
78.8
4
2
468
931
Ryan Blaney
3
13.0
11.3
95.4
42
3
722
934
Martin Truex Jr
3
13.7
10.8
90.2
10
6
780
925
Joey Logano
3
14.3
13.5
79.8
5
7
600
932
Alex Bowman
3
16.7
12.1
85.2
22
5
637
932
Michael McDowell
3
16.7
20.5
62.1
2
9
106
931
Erik Jones
3
17.0
19.1
67.2
23
0
280
931
Daniel Suarez
3
17.3
20.4
67.3
8
12
207
930
Ricky Stenhouse Jr
3
19.0
15.0
74.6
11
23
517
925
Christopher Bell
3
19.7
14.2
81.5
30
3
608
929
Ryan Newman
3
20.3
22.4
61.5
13
0
141
929
Chase Briscoe
3
21.3
24.1
54.7
1
0
22
930
Bubba Wallace
3
22.7
20.9
66.2
13
0
409
928
Cole Custer
3
23.3
24.3
51.1
0
0
45
929
Kurt Busch
3
24.0
17.5
66.2
5
0
406
672
Anthony Alfredo
3
24.0
23.0
52.0
1
4
78
929
Ryan Preece
3
24.3
23.6
53.2
4
0
104
922
Ross Chastain
3
24.7
25.4
59.9
13
0
160
892
Corey LaJoie
3
27.7
24.6
48.0
0
0
31
851
Justin Haley
3
29.0
29.6
40.3
0
0
12
920
Aric Almirola
3
29.7
25.2
50.8
0
0
29
839
BJ McLeod
3
30.7
31.6
36.5
0
0
2
909
Cody Ware
3
32.7
32.8
34.7
0
0
2
905
Garrett Smithley
3
32.7
33.5
33.5
0
0
0
905
Quin Houff
3
34.0
33.7
30.9
0
0
0
901
Josh Bilicki
3
36.3
36.5
26.7
0
0
0
884
2021 Driver Averages w/ 550hp Package
Driver
Starts
Finish
ARP
DR
FL
LL
T15
Total Laps
Kyle Busch
9
03.8
07.4
112.2
166
185
2003
2256
Kyle Larson
9
06.6
04.5
123.8
363
921
2102
2256
William Byron
9
07.4
07.2
108.6
190
201
2019
2255
Denny Hamlin
9
08.2
08.2
104.8
86
108
1925
2256
Kevin Harvick
9
09.3
12.5
90.2
62
0
1547
2255
Ryan Blaney
9
09.6
10.7
98.1
92
36
1794
2255
Alex Bowman
9
10.0
10.0
95.9
73
39
1778
2254
Brad Keselowski
9
10.2
10.8
98.6
117
189
1700
2252
Martin Truex Jr
9
10.6
10.3
93.1
77
62
1884
2247
Tyler Reddick
9
13.4
14.4
83.4
54
13
1439
2251
Chase Elliott
9
14.0
10.9
93.1
93
129
1744
2150
Chris Buescher
9
14.0
15.3
76.7
65
76
1001
2256
Austin Dillon
9
14.2
12.9
83.8
47
3
1650
2176
Matt DiBenedetto
9
15.8
14.5
77.3
21
3
1296
2251
Kurt Busch
9
16.7
12.1
90.1
125
158
1401
1782
Joey Logano
9
16.9
13.0
82.8
42
37
1603
2240
Bubba Wallace
9
17.6
18.4
71.0
23
5
922
2249
Michael McDowell
9
17.6
19.3
65.6
17
21
448
2248
Christopher Bell
9
18.9
15.7
75.9
48
9
1131
2244
Daniel Suarez
9
18.9
20.6
64.0
17
14
596
2234
Chase Briscoe
9
19.6
22.8
57.6
6
0
187
2250
Ricky Stenhouse Jr
9
20.4
17.5
68.7
17
23
997
2136
Ryan Newman
9
21.3
20.2
63.7
34
0
715
2213
Ryan Preece
9
21.8
23.4
55.5
18
1
223
2240
Erik Jones
9
21.9
22.2
57.5
28
0
321
2244
Aric Almirola
9
23.4
21.3
61.3
6
8
317
2155
Cole Custer
9
23.7
21.5
52.9
1
1
270
2132
Ross Chastain
9
24.4
22.2
61.9
16
10
495
2163
Anthony Alfredo
9
27.0
26.2
45.3
2
4
95
2217
Justin Haley
8
28.0
29.1
41.1
9
0
37
2090
Corey LaJoie
8
28.6
25.8
47.1
29
0
43
1843
Cody Ware
9
30.4
31.7
36.6
1
0
20
2203
BJ McLeod
9
30.8
32.1
35.4
0
0
9
2200
James Davison
5
32.0
32.5
34.6
0
0
18
1032
Garrett Smithley
8
32.1
32.9
32.9
0
0
9
1867
Quin Houff
9
33.2
33.5
31.0
0
0
2
2182
Josh Bilicki
9
34.8
35.8
27.6
0
0
0
2131
2020 Driver Averages At “Low Wear” 1.5-Mile Tracks
Driver
Starts
Finish
ARP
DR
FL
LL
T15
Total Laps
Brad Keselowski
9
06.4
10.2
97.3
110
108
2025
2617
Kevin Harvick
9
07.2
09.2
106.9
186
328
2141
2616
Ryan Blaney
9
07.7
06.2
114.2
236
225
2433
2616
Kyle Larson
1
09.0
09.9
95.9
5
0
249
267
Martin Truex Jr
9
09.4
08.3
105.9
208
257
2170
2603
Kyle Busch
9
10.8
10.9
96.1
127
172
2012
2616
Joey Logano
9
11.0
08.8
105.6
68
219
2133
2526
Kurt Busch
9
11.8
11.9
91.4
77
85
2040
2546
Denny Hamlin
9
12.1
15.1
90.2
144
247
1534
2609
Matt DiBenedetto
9
12.6
12.5
88.2
22
40
1824
2525
Austin Dillon
9
13.6
12.8
84.6
20
23
1892
2594
Chase Elliott
9
13.9
08.8
103.6
226
257
2095
2615
Alex Bowman
9
14.9
08.7
100.2
178
269
2207
2600
Aric Almirola
9
14.9
14.7
84.6
90
164
1475
2615
Cole Custer
9
15.7
18.8
72.0
21
5
837
2502
Erik Jones
9
15.9
14.5
80.4
63
9
1451
2615
Tyler Reddick
9
16.0
15.5
75.8
43
5
1460
2505
Christopher Bell
9
16.9
17.8
72.2
42
5
939
2601
William Byron
9
17.7
12.6
85.5
86
57
1834
2534
Ryan Newman
8
19.9
20.5
62.0
11
1
471
2328
Chris Buescher
9
20.3
21.1
65.1
22
10
537
2507
Ricky Stenhouse Jr
9
21.1
20.6
68.1
20
31
581
2289
Corey LaJoie
9
22.1
24.8
52.0
8
1
162
2607
Michael McDowell
9
22.3
23.7
55.2
5
1
254
2591
Ty Dillon
9
22.6
24.7
53.7
3
0
155
2537
Ross Chastain
2
24.5
20.1
64.2
8
0
149
668
Daniel Suarez
9
26.3
28.7
44.4
4
0
20
2590
Bubba Wallace
9
27.1
23.9
55.1
4
0
290
1957
Ryan Preece
9
29.1
24.2
52.8
1
1
85
2252
Josh Bilicki
7
32.0
34.4
33.0
9
0
3
1842
James Davison
1
32.0
34.5
34.2
0
0
0
258
Quin Houff
9
32.6
33.9
34.1
2
0
1
2496
Joey Gase
9
34.6
36.1
28.8
4
0
1
2145
BJ McLeod
4
35.0
34.7
30.7
1
0
8
980
Timmy Hill
9
35.3
35.5
29.4
14
0
5
2051
DraftKings Strategy & Dominators for Las Vegas
With Las Vegas Motor Speedway being a 1.5-mile track, and this race being 400 miles, we’re looking at 267 laps for Sunday night’s race. At this track type we usually see one main dominator and then possibly one or two smaller dominators, but there have been cases where we’ve seen three or four equal dominators. On Sunday night, I think the most likely scenario is one main dominator and then one or two smaller dominators.
Expect a lot of green flag racing this weekend. I’m estimating 230 of the 267 laps will be ran under green, which means 103.5 DraftKings FPTS for fastest laps. For laps led this week, the math on 267 laps is 66.75 DraftKings FPTS.
NASCAR is running the 550hp package this weekend. Other tracks where this package has been ran this season are: Homestead, the first Las Vegas race, both Atlanta races, Kansas, Charlotte, both Pocono races, and Michigan.
Comparable tracks ran at this season would be the first Vegas race (obviously) as well as Kansas and Charlotte. These are the three “low wear” 1.5-mile tracks raced at this year. If you go back to the 2020 season, you can also throw in Texas.
Dominators
These are the potential dominators for this weekend’s race at Las Vegas, and are listed in the order of likelihood according to my projections:
Kyle Larson
William Byron
Kyle Busch
Denny Hamlin
Ryan Blaney
Martin Truex, Jr.
Chase Elliott
Some “surprise” dominators that could happen on Sunday night include: Brad Keselowski, Alex Bowman, Joey Logano, and Christopher Bell.
The optimal DraftKings lineup for Las Vegas Sunday night according to my Projections is:
Kyle Larson
Ryan Blaney
William Byron
Alex Bowman
Ricky Stenhouse, Jr.
Anthony Alfredo
Confidence Rating = 7.8/10. This is definitely a tournament lineup because it’s rolling with the 1st-, 2nd-, and 3rd-place starters on Sunday night, but honestly, I could see it working out. Larson is the favorite to win and dominate, but William Byron is a solid sleeper that should be good for 20+ fastest laps and some laps led. The same goes for Ryan Blaney. With Alex Bowman, you’re just hoping he doesn’t have one of his “off nights”, but he finished 5th at Charlotte and has wound up 9th or better in six of the nine 550hp package races this season.
GPP / Tournament Picks
Photo Credit: Patrick Smith | Getty Images
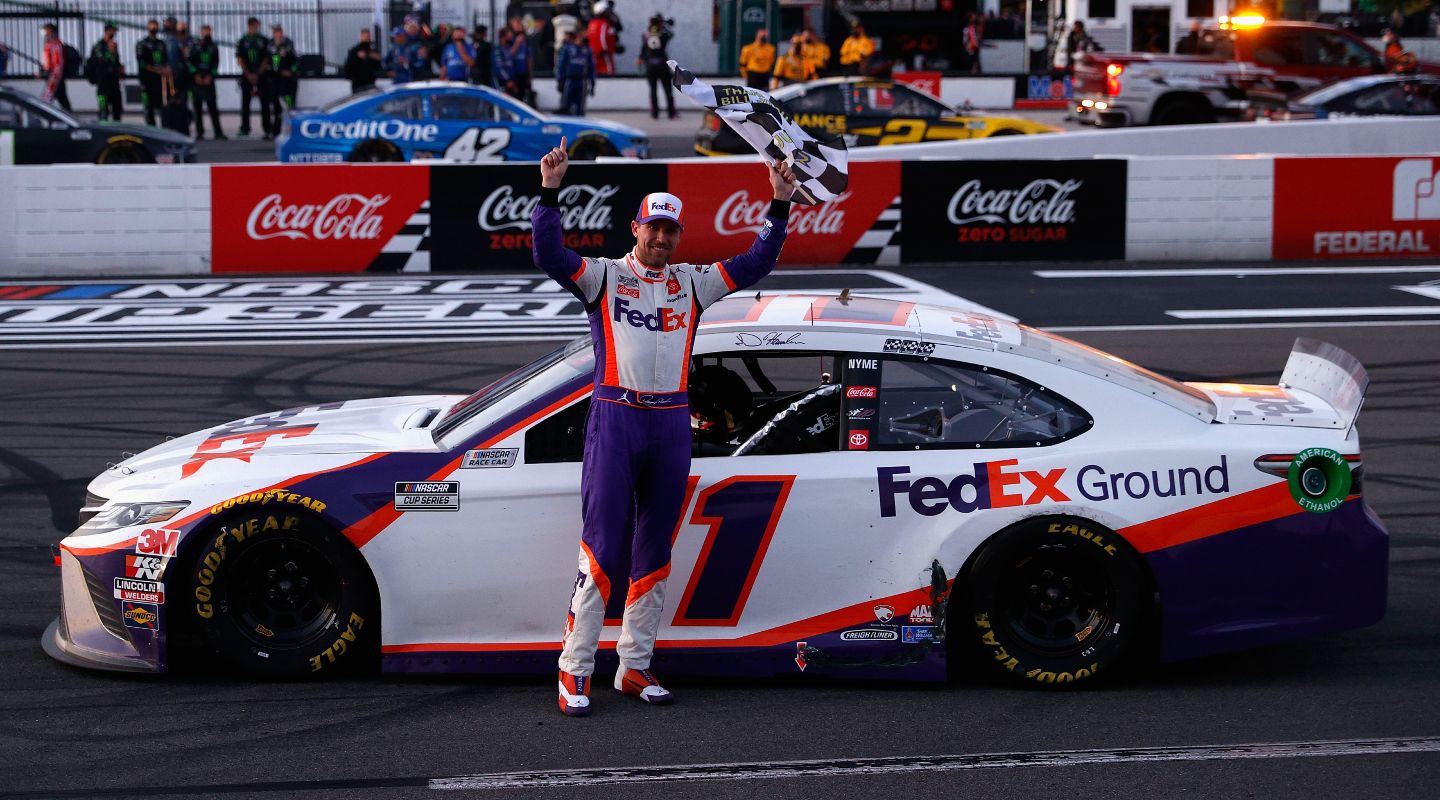
Denny Hamlin ($10,500) – I hate to say it because I can’t stand the guy, but Denny Hamlin has brought his A game to kick off these 2021 Playoffs. Now, I have no doubt that he’s eventually going to choke away another chance at a Championship, but for the time being, I think it’s worth being overweight on James Dennis Alan Hamlin in DFS. The two obvious plays in this mid-$10,000 price range on DraftKings this weekend are Kyle Busch ($10,800) and Chase Elliott ($10,200), with Denny Hamlin sandwiched in between. As I said in the beginning of this article, though, who led the most laps int he Las Vegas Playoff race last season? Denny Hamlin. Who led 47 laps here at Las Vegas back in March? Denny Hamlin. Who’s projected to finish 2nd by my algorithm this weekend? Denny Hamlin.
William Byron ($8,900) – This price range has so much value in it, and it’s hard to say which drivers are going to get more ownership than the others, but the strongest play here is William Byron. Even though he’s starting up in 3rd, I think DraftKings priced him a little too low for Sunday night’s race, because Willy B can definitely contend in the South Point 400. Looking at similar tracks this year, Byron came home 8th in the first Vegas race, 9th at Kansas, and 4th at Charlotte. He put up 31 fastest laps at Vegas, 17 fastest laps at Kansas, and 51 fastest laps at Charlotte. If he can post his normal amount of dominator points on Sunday night and maybe even lead 20-30 laps, Byron can definitely make it into the optimal lineup with a top 5 finish.
Michael McDowell ($5,900) – Getting off the chalk in the lower-dollar range is always something we need to look at. This week, it’s likely that Anthony Alfredo ($5,700) will be chalk due to his 32nd starting spot, as well as Chase Briscoe ($6,000) because of his recent uptick in performance. You could even throw in Corey LaJoie ($6,200) because he’s been pretty solid this season. For a pivot, though, I’m looking at Michael McDowell. The 550hp package is where McDowell is at his best, and he’s finished inside the top 20 in eight of the nine races in it this season, including a 17th in the first Las Vegas race, a 13th at Kansas, and a 20th at Charlotte. If McDowell can pull off an 18th-place finish on Sunday night, he’ll score 30 DraftKings FPTS. For comparison, Alfredo needs to finish 22nd to hit that mark, Briscoe needs to finish 16th, and LaJoie needs to finish 20th.
BONUS: Austin Dillon ($8,100) – There is a ton of value in this $8,000s to low $9,000s range on DraftKings this weekend, and I wouldn’t be surprised one bit if the optimal lineup came from stacking drivers in here. And while the “big boys” like Blaney, Byron, Keselowski, and Bell are going to (understandably) get plenty of ownership, a pivot I really like is going down here to Austin Dillon. Here’s the thing: Austin Dillon has been really good in the 550hp package this season, particularly shining at the Coca-Cola 600 at Charlotte, which was also run at night. AD finished 12th in the first Vegas race this season, 10th at Kansas, and 6th at Charlotte, and don’t forget that he was a legitimate contender at Michigan in August before getting wrecked (Goodyear is brining the same tire combination this weekend). Austin starts back in 15th on Sunday night and if he can pull off a top 6 finish like he did at Atlanta and Charlotte this year, he could sneak into the optimal. Here at Vegas, he finished 4th in the first race last season and has wound up 13th or better in six of the last nine.
Stacking Dennys Podcast with Jordan & RotoDoc
Cash Core Drivers
Photo Credit: Kevin C. Cox/Getty Images
Kyle Larson ($11,100) – Just like last weekend at Bristol, it’s hard to make a case against Kyle Larson this weekend. He’s starting on the pole, for one. Also, he’s been dominant at similar tracks this year. Looking at the first Vegas race, he had 57 fastest laps, 103 laps led, and ended up winning. At Kansas, he had 67 fastest laps, 132 laps led, but finished 19th after the wackiness at the end. And then at Charlotte, he had 69 fastest laps (nice), 327 laps led, and won from the pole. It’s hard to imagine Kyle Larson not being one of the highest-scoring DraftKings drivers on Sunday night unless he has mechanical issues or wrecks, both of which I do not try to predict.
Chase Elliott ($10,200) – I debated for quite a while between writing up Kyle Busch ($10,800) or Chase Elliott in this spot, but ultimately ended up landing on Chase because of the price discount. Both drivers are projected to score similarly this weekend, and both have similar upside as well. As far as Las Vegas Motor Speedway goes with Chase Elliott, he has always ran well, but finishing has been a problem. Chase has won three of the last six Stages and has also led 165 laps over the last three races. His finishes during that span? A 13th earlier this year and a 26th- and 22nd-place finishes last season. This #9 Chevrolet should be a legitimate top 5 contender, if not race-winning contender, on Sunday night if nothing goes wrong. Elliott finished 5th at Kansas this season and 2nd at Charlotte, posting 39 fastest laps in the latter race.
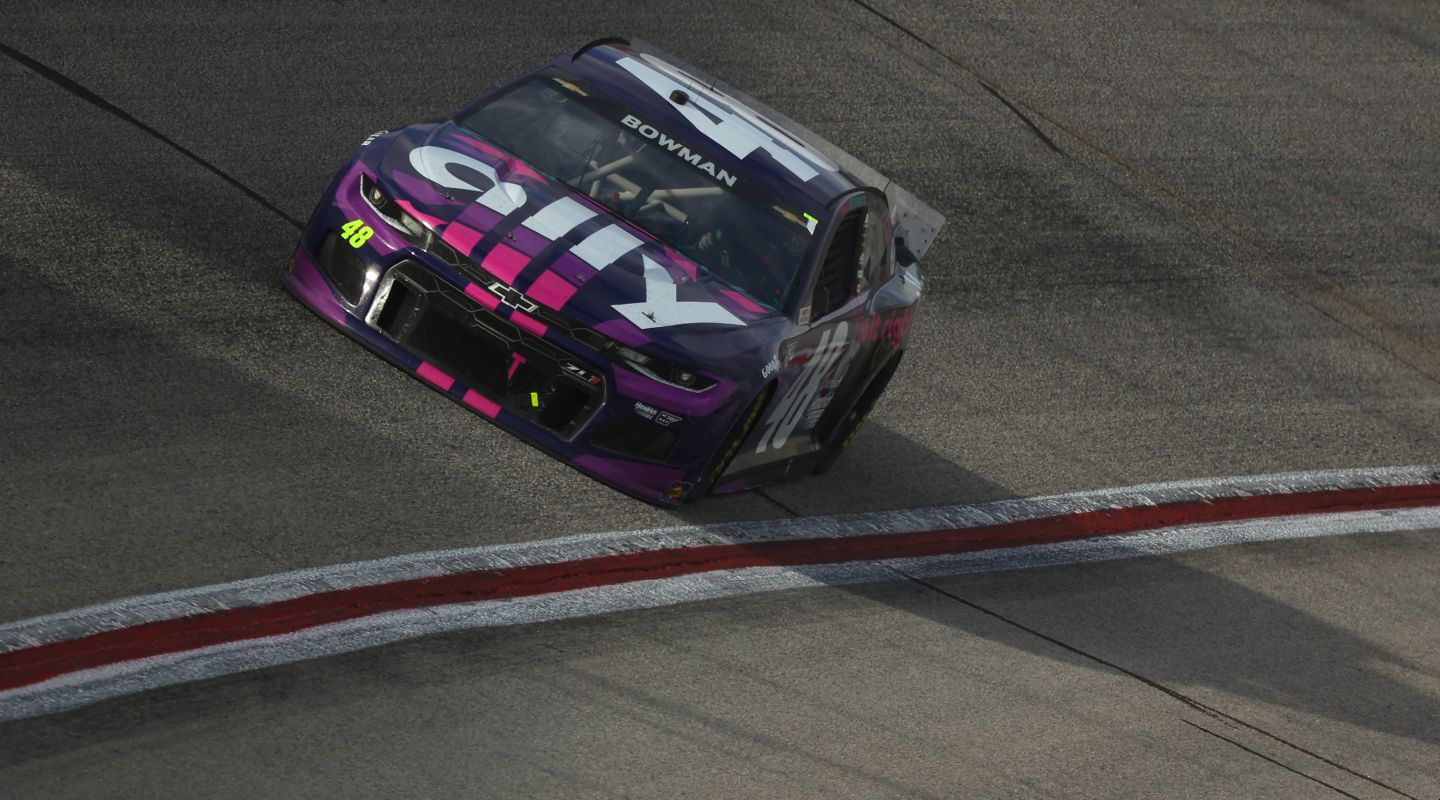
Alex Bowman ($8,300) – He may be #DeadToMe, but Alex Bowman priced at $8,300 on DraftKings this weekend is a steal, and while I do hold grudges, I’m not stupid. Bowman is really good at steep tracks. Hendrick Motorsports is really good at intermediate tracks this year. Bowman is starting 8th and has top 5 finishing potential. Need I say more? In the last two Playoff races here at Las Vegas, Bowman The Showman has finished 5th and 6th, and he also put up 20 fastest laps in last year’s event. In this year’s first Vegas race, he had 14 fastest laps but finished 27th after a late tire issue. Still, Bowman has ended up 9th or better in six of the nine 550hp races, four of which were also top 5s.
South Point 400 at Las Vegas DraftKings Driver Projections
The following chart takes into account the very basics: the starting position and the projected finish of each driver. The projected finishes are averaged from six different ranking systems. Also factored in are projected laps led and fastest laps for each driver. You can click the headers below to sort the chart by that attribute. By default it is sorted by average projected FPTS.
Practice and qualifying for this year's Coca-Cola 600 at Charlotte Motor Speedway are scheduled to take place on Saturday evening, but the weather forecast...


")
")
")

")
")
")