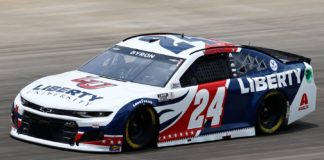
These are my final thoughts and strategies to consider for Sunday afternoon’s race at Pocono Speedway, as well as projected DraftKings FPTS for each driver. The chart below is explained but if you have any questions please don’t hesitate to contact me.
- THIS POST WAS UPDATED AT 2 PM EASTERN. THE CHART BEFORE THAT WAS INCORRECT. THE ONE BELOW IS CORRECT. SORRY FOR THE ERROR.
- There are only 160 laps scheduled for Sunday’s race at Pocono, which means that only 40 total FPTS will be awarded for laps led with ~70 awarded for fastest laps (depending on the number of cautions, obviously). This places a higher emphasis on finish and place differential FPTS, just like at Indianapolis last week.
- Expect this race to play out like the last time we were at Pocono. Kyle Busch has the best car and is going to dominate this race, except for when the Stage cautions come and another driver gets ahead of him. Will he finally be able to get to victory lane, though?
- Track position is everything at “The Tricky Triangle.” Drivers that qualify up front here tend to finish there as well.
Projected Base FPTS at Pocono 2
The following chart takes into account the very basics: the starting position and the projected finish of each driver. The projected finishes are averaged from five different ranking systems, using both mathematical equations as well as personal rankings. This chart also includes the average projected base + laps led DraftKings FPTS as well as the dollar per FPT. I don’t try to project fastest laps–that’s up to you. You can click the headers below to sort the chart by that attribute. By default it is sorted by average projected FPTS.
| Driver | DraftKings Salary | Starting Position | Avg. Projected Finish | Proj Laps Led | Avg Proj Base + Laps Led FPTS | Dollar Per FPT |
|---|---|---|---|---|---|---|
| Kyle Busch | $10,700 | 1 | 03.8 | 69 | 55.7 | $279 |
| Kevin Harvick | $10,200 | 6 | 03.5 | 9 | 48.3 | $222 |
| Kyle Larson | $10,100 | 16 | 05.7 | 3 | 47.6 | $216 |
| Matt Kenseth | $9,200 | 15 | 07.2 | 0 | 43.8 | $210 |
| Martin Truex Jr | $10,500 | 2 | 04.8 | 29 | 43.5 | $290 |
| Brad Keselowski | $9,100 | 11 | 08.5 | 4 | 42.4 | $220 |
| Chase Elliott | $9,500 | 13 | 08.7 | 3 | 42.2 | $229 |
| Ryan Blaney | $8,700 | 5 | 05.8 | 15 | 40.4 | $238 |
| Denny Hamlin | $9,700 | 4 | 06.0 | 9 | 38.7 | $266 |
| Dale Earnhardt Jr | $7,800 | 23 | 15.8 | 0 | 37.4 | $209 |
| Austin Dillon | $6,900 | 26 | 18.8 | 0 | 34.4 | $201 |
| Joey Logano | $8,800 | 10 | 11.8 | 0 | 33.6 | $262 |
| Erik Jones | $8,300 | 9 | 10.7 | 7 | 33.6 | $261 |
| Kurt Busch | $8,500 | 18 | 15.3 | 0 | 32.4 | $262 |
| Jimmie Johnson | $9,600 | 14 | 13.3 | 0 | 31.6 | $304 |
| Ryan Newman | $7,600 | 20 | 15.5 | 0 | 31.6 | $241 |
| Ricky Stenhouse Jr | $7,000 | 21 | 15.5 | 0 | 31.4 | $223 |
| Clint Bowyer | $8,000 | 7 | 11.0 | 6 | 30.1 | $280 |
| Ty Dillon | $6,600 | 30 | 23.5 | 0 | 29.6 | $223 |
| Chris Buescher | $6,200 | 24 | 19.7 | 0 | 27.2 | $228 |
| Daniel Suarez | $7,200 | 8 | 13.7 | 2 | 25.7 | $286 |
| Jamie McMurray | $8,100 | 3 | 11.0 | 4 | 24.0 | $352 |
| AJ Allmendinger | $6,100 | 28 | 24.2 | 0 | 24.0 | $254 |
| Kasey Kahne | $7,400 | 12 | 17.7 | 0 | 22.4 | $330 |
| Paul Menard | $6,700 | 27 | 24.8 | 0 | 22.2 | $302 |
| Danica Patrick | $5,900 | 22 | 22.8 | 0 | 21.6 | $273 |
| Trevor Bayne | $6,500 | 19 | 20.7 | 0 | 21.0 | $310 |
| David Ragan | $5,100 | 33 | 29.0 | 0 | 19.0 | $268 |
| Aric Almirola | $6,000 | 25 | 25.8 | 0 | 17.3 | $346 |
| Landon Cassill | $5,400 | 31 | 29.7 | 0 | 16.6 | $325 |
| Gray Gaulding | $5,000 | 35 | 32.0 | 0 | 16.2 | $309 |
| Michael McDowell | $5,600 | 17 | 23.2 | 0 | 14.6 | $384 |
| Cole Whitt | $4,900 | 32 | 31.3 | 0 | 14.4 | $340 |
| Matt DiBenedetto | $5,200 | 29 | 29.7 | 0 | 14.2 | $366 |
| Jeffrey Earnhardt | $4,700 | 38 | 35.2 | 0 | 12.0 | $392 |
| Derrike Cope | $4,600 | 37 | 35.2 | 0 | 11.4 | $404 |
| Corey Lajoie | $4,500 | 34 | 34.3 | 0 | 08.8 | $511 |


You have quite a few of the starting spots wrong, does that change anything?
Hey Dan, I had the wrong chart initially posted, but I did fix it once I noticed the error. Thanks for the heads up!