
VIVVVAAAA, LAS VEGAS! We’re back in Sin City for the second time this season, as the South Point 400 kicks off Round 2 of the Playoffs this weekend on Sunday night. I’m not really sure why NASCAR decided to run this race at night, especially with no holiday on Monday, but here we are. We have just seven races left of the 2020 Cup Series season and we’re going to make the most of it!
Las Vegas is a 1.5-mile track and is in the category of “low wear” when it comes to venues of that length. We’ve had many races on this track type this season, and lucky for you I’ve created a cheat sheet with all of the significant DraftKings data you need to see who has ran well at the 1.5-milers in 2020. Click here to see the 1.5-Mile Cheat Sheet for Las Vegas 2.
Tire-wise, Goodyear is switching things up this time around compared to the tires we had here back in February for the second race of this season. Instead of bringing those same tires, the teams will be running D-4976 on the left side and D-4986 on the right side. These are the same left sides that were used at Kentucky and Texas this year, as well as in the two Michigan races–although remember that Michigan is a 2-mile track, while Kentucky and Texas are 1.5-milers just like Las Vegas. The D-4986 tire for the right sides has not been used this season.
Kevin Harvick is on the pole for Sunday night’s race at Las Vegas Motor Speedway, and if you need to see the full starting lineup, you can do so by clicking here. Now let’s gooo!!
Speed Report in 2020 After Bristol 2
The “cheat code” team of Harvick and Childers flexed their muscles again last weekend in Bristol, and now have a ridiculous average rank of 2.0 over the last six races when it comes to Green Flag Speed. I don’t think they’re actually cheating, obviously, but the speed that this #4 Ford has right now is downright ridiculous. Harvick had enough speed to win the championship earlier on in the season, and now he’s turned on the afterburners.
Over the last six races here are the fastest drivers in terms of Green Flag Speed:
- Kevin Harvick (2.0 average rank)
- Chase Elliott (6.2 average rank)
- Joey Logano (6.3 average rank)
- Martin Truex, Jr. (7.8 average rank)
- Kyle Busch (7.8 average rank)
You can click here to check out the updated Cheat Sheet on Green Flag Speed and see how every driver ranks in that category plus more, not only for the last six races but for the whole season.
DraftKings Strategy for Las Vegas 2
As is the case with most races this year, I think your profitability on Sunday night is going to come down to which side of the fence you’re on with the pole sitter, Kevin Harvick ($11,700). He’s either going to dominate a significant portion of this race or he’s going to be a dud like we’ve seen many times this year with the pole sitter. DraftKings also didn’t help us out a lot here with Harvick by pricing him so high.
Now obviously, as you can see with my Projections below, I have Harvick projected as the highest-scoring driver for this race on Sunday night. But from a strategy perspective, I don’t hate the idea of being underweight on him, and let me tell you why: only once in the last seven Las Vegas races has the pole sitter led the most laps. Ironically, though, it was Harvick back in the first race here last season. Still, that’s noteworthy. Also, the pole sitter has only ended up in the top 3 of lap leaders twice on the last seven races here.
Furthermore, the pole sitters on the low-wear 1.5-mile tracks this season have not faired well. We’ve had six races on low-wear 1.5-milers this year, and four of the six pole sitters have led 11 laps or less. That includes here at Las Vegas back in February when Kyle Busch led zero laps. On average, the pole sitter on low-wear 1.5-mile tracks in 2020 has led less than 20 laps per race!
Finally, let’s look at the four times that Kevin Harvick has started on the pole this season: 9 laps led at Kansas, zero laps led at the Daytona Road Course, 6 laps led at Daytona, and 41 laps led at Richmond. Throw in the fact that I’m not completely sold on Rodney Childers’ setups (at least to dominate) at night races on 1.5-mile tracks–just look at the aforementioned Kansas race–and it’s not crazy to think that Harvick won’t be worth the inflated DraftKings salary this weekend. My contrarian brain likes the concept of being underweight here, especially when you can fit in a trio such as Martin Truex, Jr. ($10,600), Joey Logano ($10,300), and Chase Elliott ($9,700) in the same lineup by not paying up for Harvick.
Just some food for thought there. You need to nail the main dominator (or two) when it comes to Las Vegas races but the rest of the lineup is all about guys finishing up front–and that will likely be determined by the final restart. We’ve seen it happen time and time again on 1.5-mile tracks this season, there’s no reason to think that that will change now. Speaking of which, click here for my 1.5-mile track cheat sheet full of data for every driver on this track type in 2020.
In total, we’re looking at just around 182 DraftKings dominator FPTS up for grabs on sunday night–66.75 for laps led, and around 115 for fastest laps. this race on average is green for 87% of the scheduled distance.
Fastest laps at 1.5-mile tracks aren’t as spread out like we have seen over the last couple of weeks at Richmond and Bristol. On average, here’s how the fastest laps usually play out here:
- Driver with most fastest laps = 24.43% of the total
- Driver with 2nd-most fastest laps = 16.03% of the total
- Driver with 3rd-most fastest laps = 12.47% of the total
Now for the the breakdown for laps led. The last four races here at Vegas we’ve seen a two- or three-dominator race when it comes to this statistic, in 2018 we did see Kevin Harvick lead 80% of the laps en route to a dominating victory. Here’s how it is on average at Las Vegas:
- Driver with most laps led = 45.40% of the total
- Driver with 2nd-most laps led = 24.63% of the total
- Driver with 3rd-most laps led = 10.50% of the total
One thing worth noting: only once in the last five Las Vegas races has the driver with the most laps led gone on to win the race. The last time was, of course, Kevin Harvick in 2018.
GPP / Tournament Picks I Love for the South Point 400 at Las Vegas
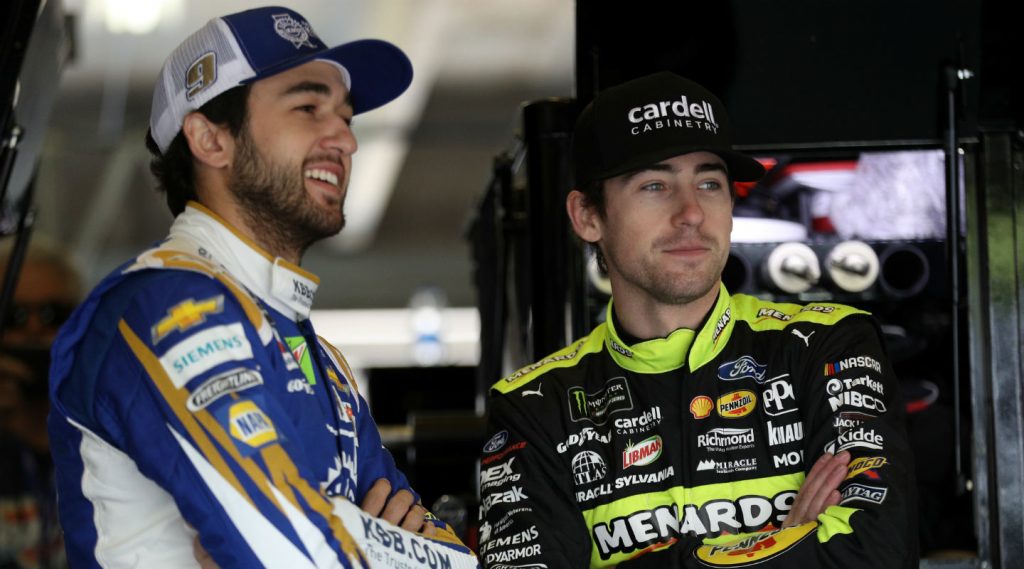
Chase Elliott ($9,700) – If you remember back to the first Las Vegas race this season, Chase Elliott easily had the most dominant car. He started 10th but still ended up winning the first two Stages, leading 70 laps, and putting up a race-high 48 fastest laps. Unfortunately a late tire issue kept Chase from getting to victory lane, but he no doubt had the best car that day. This time, Chase is starting up in 3rd, and if he can get the lead away from Harvick early on, we could see another dominating effort from this #9 Chevrolet. Elliott is averaging 46.2 DraftKings FPTS on the low-wear 1.5-mile tracks this season thanks in major part to his 23.7 fastest laps and 22.7 laps led per race on this track type.
Ryan Blaney ($9,100) – Honestly, I’d almost consider Ryan Blaney a cash game play, too, but I definitely like having a large amount of him in GPPs/tournaments. Here’s the thing: yes, Ryan Blaney has disappointed lately. Yes, he’s been unreliable all season long. But you can’t overlook how great this car has been on the 1.5-mile tracks in 2020. Specifically at the low-wear 1.5-milers, Blaney has the most DraftKings FPTS (61.8 per race), the most fastest laps (29.8 per race), and the 3rd-most laps led (34 per race). Oh, and don’t forget that Penske Racing has had a stranglehold on Las Vegas Motor Speedway as of late. Blaney himself would have went to victory lane here back in February if it wasn’t for that late caution and the #12 team’s decision to pit. Even so, Blaney has five finishes of 7th or better in his last seven Vegas starts, and he’ll roll off the grid from 15th here on Sunday night.
Chris Buescher ($6,200) – This weekend, I love the driver salary of Chris Buescher but hate the starting spot (16th). That’s always my cue to be overweight on someone in GPPs/tournaments. Additionally, I think Buescher can legitimately maintain his starting spot, and maybe even move up a few positions on Sunday night. The last five Las Vegas races have all ended with Buescher inside the top 18, and back here in February he came home with a career-best 14th-place finish. At Kentucky and Texas this year–where Goodyear brought the same left side tire as they did this weekend–Buescher came home 20th and 19th. His average finish on the low-wear 1.5-mile tracks in 2020 in 19.8 with an average of 3.3 fastest laps per race. One last thing to note: Buescher ranks 15th-fastest in the series on this track type this season when it comes to Green Flag Speed.
Cash Core Drivers I Love for the South Point 400 at Las Vegas
Kevin Harvick ($11,700) – I can make a case for going underweight on Kevin Harvick in GPPs/tournaments just from a strategy perspective, but I don’t think it’d be wise to do that in cash games. This #4 Ford is in a different stratosphere of speed right now, and Harvick is a constant front runner whenever we come to Las Vegas Motor Speedway. Over the last six events at this track, Harvick has the most laps led (455) and the 3rd-best average driver rating (116.4). This year on the low-wear 1.5-mile tracks, he he has the 2nd-best average finish (6.2), the 2nd-most DraftKings FPTS (57.2 per race), and the 2nd-most laps led (35.8 per race).
Ricky Stenhouse, Jr. ($7,800) – Sometimes I truly don’t understand DraftKings and their driver pricing. This week they jumped William Byron up to $9,400 with him starting 28th, but then plunked Ricky Stenhouse, Jr. at $7,800 when he’s starting 33rd. And even though it’s an awkward driver salary in general, the place differential potential here is very difficult to pass up. Plus, Stenhouse has a knack for lucking into good finishes here at Las Vegas, including his 3rd-place run here in February. That’s two finishes of 6th or better for him in the last three Sin City races. Additionally, Stenhouse has finished 14th or better in four of his last seven Vegas starts. One thing to note: the JTG Daugherty cars have had some awful finishes on the 1.5-mile tracks this year, but it wasn’t due to lack of speed; Stenhouse’s average Green Flag Speed ranking of 15.3 on the low-wear 1.5-mile tracks this season is 16th-best in the series.
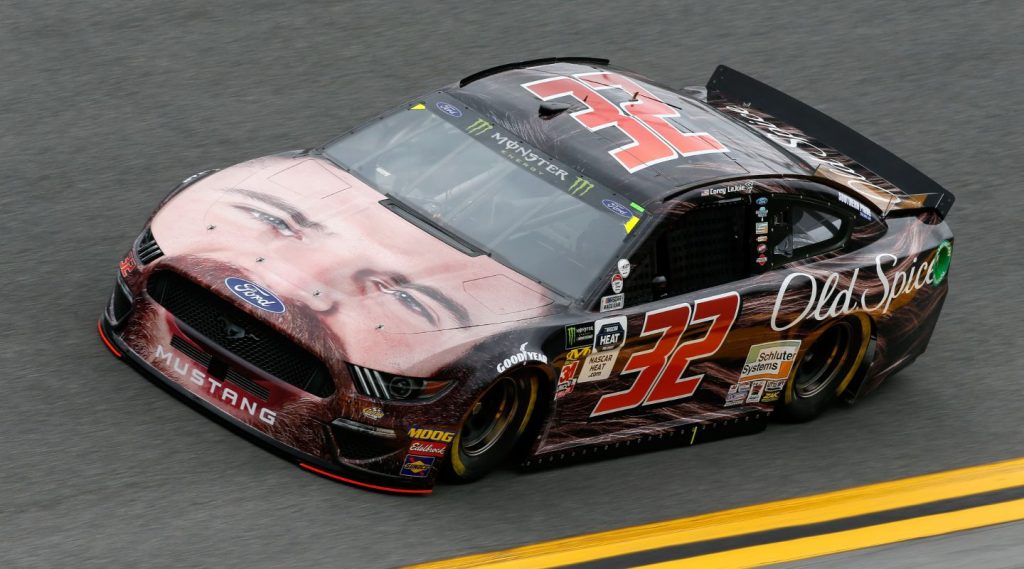
Corey LaJoie ($5,500) – Over the last couple of years, Corey LaJoie has emerged as one of the best Fantasy NASCAR picks at tracks like Daytona and Talladega, but I’ll let you in on a little secret: he’s quietly been one of the most consistent drivers on 1.5-mile tracks in 2020 as well. On the low-wear 1.5-milers this season, LaJoie is averaging a finish of 20.7 over the six races this season, averaging 31.8 DraftKings FPTS per race along the way. That second number is 15th-best in the series. This weekend, LaJoie starts back in 31st and is priced at only $5,500. I’ll have plenty of him all around with my lineups.
Las Vegas South Point 400 DraftKings Projections
The following chart takes into account the very basics: the starting position and the projected finish of each driver. The projected finishes are averaged from five different ranking systems. Also included are projected laps led and fastest laps for each driver. You can click the headers below to sort the chart by that attribute. By default it is sorted by average projected FPTS.
| Driver | Starting Position | DraftKings Salary | Avg Proj FPTS | Avg. Projected Finish | Proj Laps Led | Proj Fastest Laps | Dollar Per FPT |
|---|---|---|---|---|---|---|---|
| Kevin Harvick | 1 | $11,700 | 83.0 | 02.7 | 88 | 41 | $141 |
| Martin Truex Jr | 11 | $10,600 | 65.7 | 05.3 | 30 | 24 | $161 |
| Joey Logano | 5 | $10,300 | 63.1 | 03.2 | 41 | 19 | $163 |
| Brad Keselowski | 12 | $11,400 | 62.6 | 04.7 | 21 | 18 | $182 |
| Chase Elliott | 3 | $9,700 | 58.0 | 06.0 | 46 | 21 | $167 |
| Ryan Blaney | 15 | $9,100 | 52.7 | 06.7 | 0 | 18 | $173 |
| Denny Hamlin | 10 | $11,000 | 48.3 | 06.5 | 4 | 12 | $228 |
| William Byron | 28 | $9,400 | 46.7 | 14.5 | 0 | 8 | $201 |
| Kyle Busch | 2 | $10,000 | 43.8 | 06.7 | 18 | 10 | $228 |
| Jimmie Johnson | 18 | $8,900 | 39.3 | 13.3 | 0 | 7 | $226 |
| Ricky Stenhouse Jr | 33 | $7,800 | 37.8 | 20.5 | 0 | 2 | $206 |
| Alex Bowman | 8 | $7,300 | 36.8 | 11.5 | 5 | 12 | $199 |
| Erik Jones | 13 | $8,500 | 36.2 | 12.7 | 0 | 6 | $235 |
| Tyler Reddick | 14 | $6,900 | 36.2 | 12.8 | 0 | 5 | $191 |
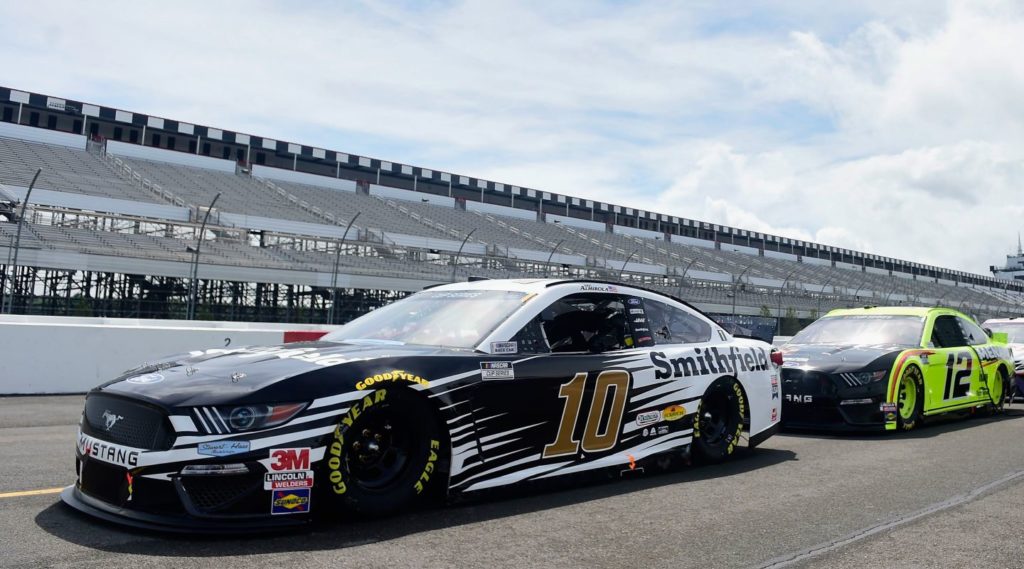
| Aric Almirola | 4 | $8,300 | 35.6 | 09.7 | 11 | 8 | $233 |
| Matt DiBenedetto | 19 | $7,900 | 35.5 | 14.0 | 0 | 1 | $223 |
| Kurt Busch | 9 | $8,700 | 35.3 | 09.7 | 0 | 4 | $246 |
| Austin Dillon | 7 | $7,600 | 33.6 | 10.7 | 3 | 2 | $226 |
| Cole Custer | 22 | $6,600 | 32.8 | 17.8 | 0 | 1 | $201 |
| Ryan Newman | 27 | $7,400 | 31.2 | 21.2 | 0 | 2 | $237 |
| Christopher Bell | 26 | $7,100 | 30.2 | 20.8 | 0 | 0 | $235 |
| Chris Buescher | 16 | $6,200 | 26.7 | 17.7 | 0 | 3 | $233 |
| Matt Kenseth | 20 | $6,500 | 26.2 | 19.8 | 0 | 1 | $248 |
| Corey Lajoie | 31 | $5,500 | 26.2 | 25.3 | 0 | 0 | $210 |
| Clint Bowyer | 6 | $8,100 | 26.2 | 13.3 | 0 | 3 | $310 |
| John H. Nemechek | 25 | $6,400 | 22.5 | 23.8 | 0 | 0 | $284 |
| Ty Dillon | 24 | $5,900 | 18.7 | 25.5 | 0 | 0 | $316 |
| Bubba Wallace | 23 | $6,700 | 17.5 | 25.3 | 0 | 0 | $383 |
| JJ Yeley | 37 | $5,100 | 15.8 | 32.7 | 0 | 0 | $322 |
| Brennan Poole | 35 | $4,600 | 14.8 | 32.3 | 0 | 0 | $310 |
| Daniel Suarez | 29 | $5,700 | 14.2 | 29.7 | 0 | 0 | $402 |
| Josh Bilicki | 38 | $4,900 | 13.5 | 34.5 | 0 | 0 | $363 |
| Michael McDowell | 17 | $6,100 | 11.8 | 24.8 | 0 | 0 | $515 |
| Ryan Preece | 21 | $5,600 | 11.3 | 27.2 | 0 | 0 | $494 |
| Quin Houff | 32 | $4,800 | 10.3 | 33.2 | 0 | 0 | $465 |
| Gray Gaulding | 30 | $5,000 | 09.7 | 32.5 | 0 | 0 | $517 |
| Joey Gase | 34 | $4,700 | 07.5 | 35.5 | 0 | 0 | $627 |
| Chad Finchum | 39 | $5,200 | 06.7 | 38.2 | 0 | 0 | $780 |
| Timmy Hill | 36 | $5,300 | 05.5 | 37.3 | 0 | 0 | $964 |
")
")
")
")
")
")


")
")
")

")
")
")